Public transport data
Public transport data can broadly be divided into 1) data related to the public transport network itself: available modes, location of stops/stations, routes, and schedules, and 2) data about actual travel patterns and system performance, such as the number of passengers on board (occupancy) or delays.
The first type of data is planned information and typically follows available standards such as the General Transit Feed Specification (GTFS) or Network Timetable Exchange (NeTEx). The second type of data are in Koutsopoulos et al. (2019)1 referred to as automated data sources and include the main categories: automated passenger counting systems (APC), automated vehicle location systems (AVL), and automated fare-collection (AFC).
In the APT-R project, we focus on APC and AVL data and below is a brief description of these data sources.
APC and AVL data
As the name suggests, automated passenger counting systems counts the number of passengers boarding and alighting a public transport vehicle. Such telematics systems consist of in-vehicle sensors using e.g. infrared beams, cameras or other sensor technology to register the number of people entering or exiting a vehicle’s doors. As well as units to store, process, and transmit the count data to land side back-end solutions.
The illustration in Fig. 1 shows two passengers boarding a bus at stop \(s_i\).
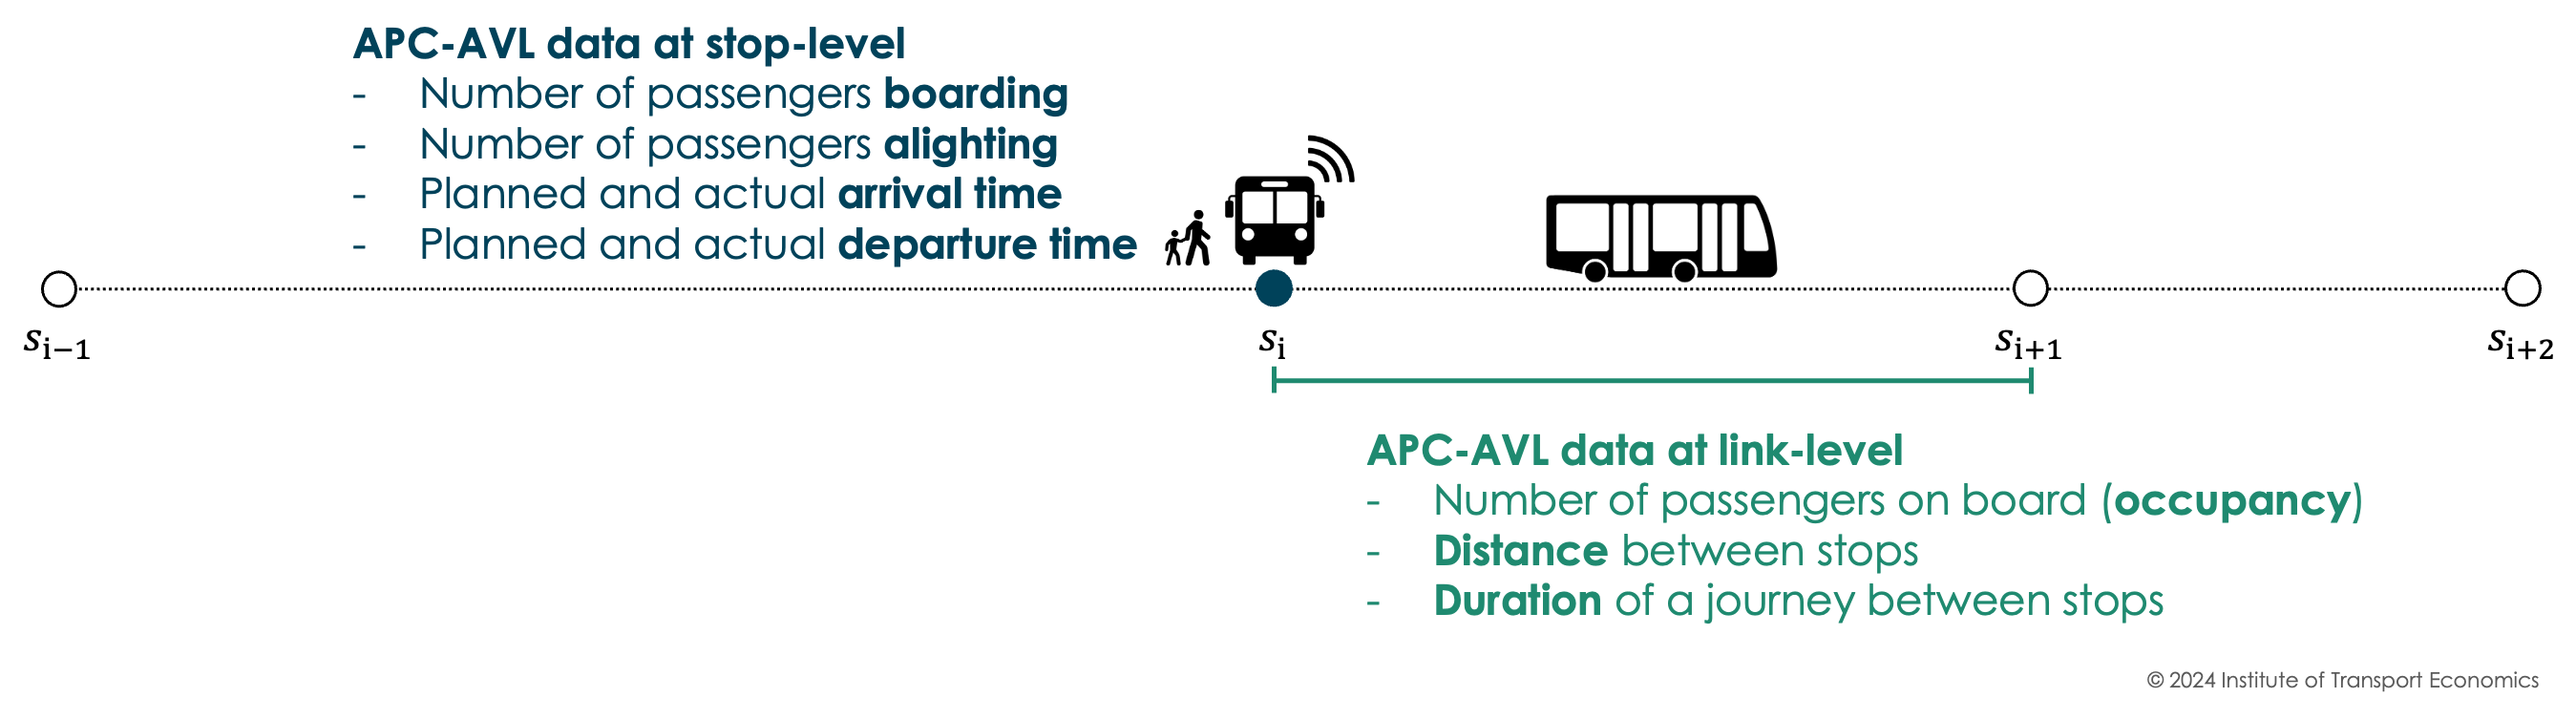 In addition to the passenger counts, information about the stop, route, and actual arrival and departure time is found in APC datasets. The latter is a type of automated vehicle location data at stop level. However, AVL is also available at higher resolutions. It is real-time GPS data about vehicle locations which are used for both real-time passenger information and analyses of public transport routes and system performance.
Useful to know
- Passenger counts in a dataset could be raw counts from the system or values that have been post-processed in some way before they are shared. E.g. imputation of missing values, balancing the number of passengers boarding and alighting, unrealistic counts being removed etc. Before using APC data for modelling, it would be useful to know if the counts have been post-processed and if so, in what way.
Footnotes
H. N. Koutsopoulos, Z. Ma, P. Noursalehi, and Y. Zhu, ‘Chapter 10 - Transit Data Analytics for Planning, Monitoring, Control, and Information’, in Mobility Patterns, Big Data and Transport Analytics, C. Antoniou, L. Dimitriou, and F. Pereira, Eds. Elsevier, 2019, pp. 229–261.↩︎